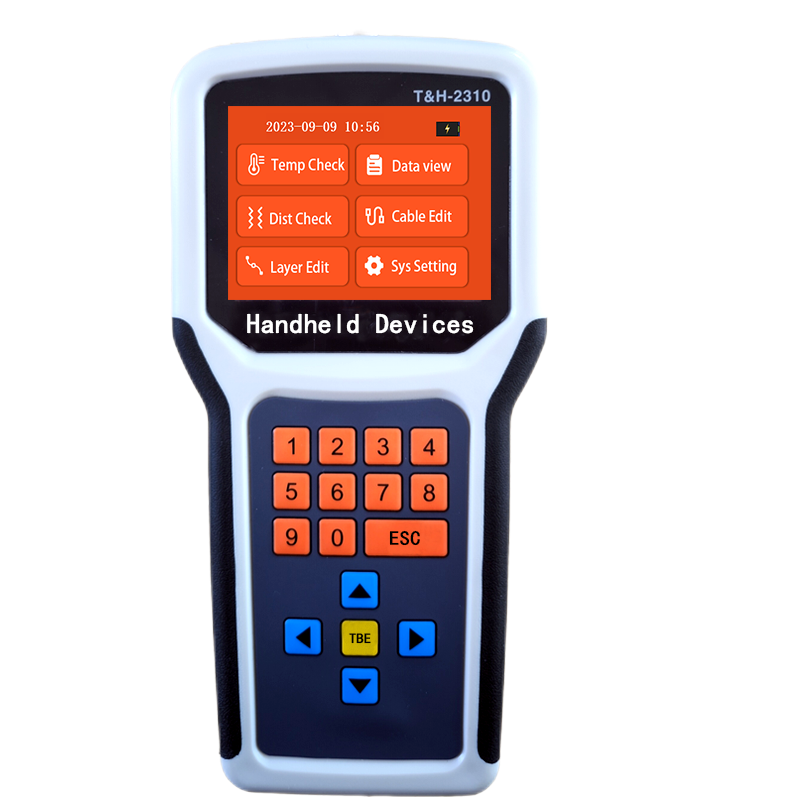
Handheld version is an economical grain bin temperature monitoring solutiion. It only needs an Android phone to connect with the handheld to read the connected grain bin temperature cable connected of the silo. Hand held can support more than 800 meter extension cables and 200 grain bin temperature sensors readings. You can extend the grain bin temperature cable anywhere in the factory and read it with an Android phone. The android application can record the temperature value and display the number of each sensor of the cable in the silo. The android application can also connect to PC wirelessly to display real-time temperature data or historical temperature data on PC or export temperature records in Excel format through the software.

Advantages
- Economical solution
- Clear temperature distribution
- Export temperature data to excel
- Extra long temperature measurement distance
- Up to 200 sensors can be read at the same time.
- Android app can be connected to the computer.
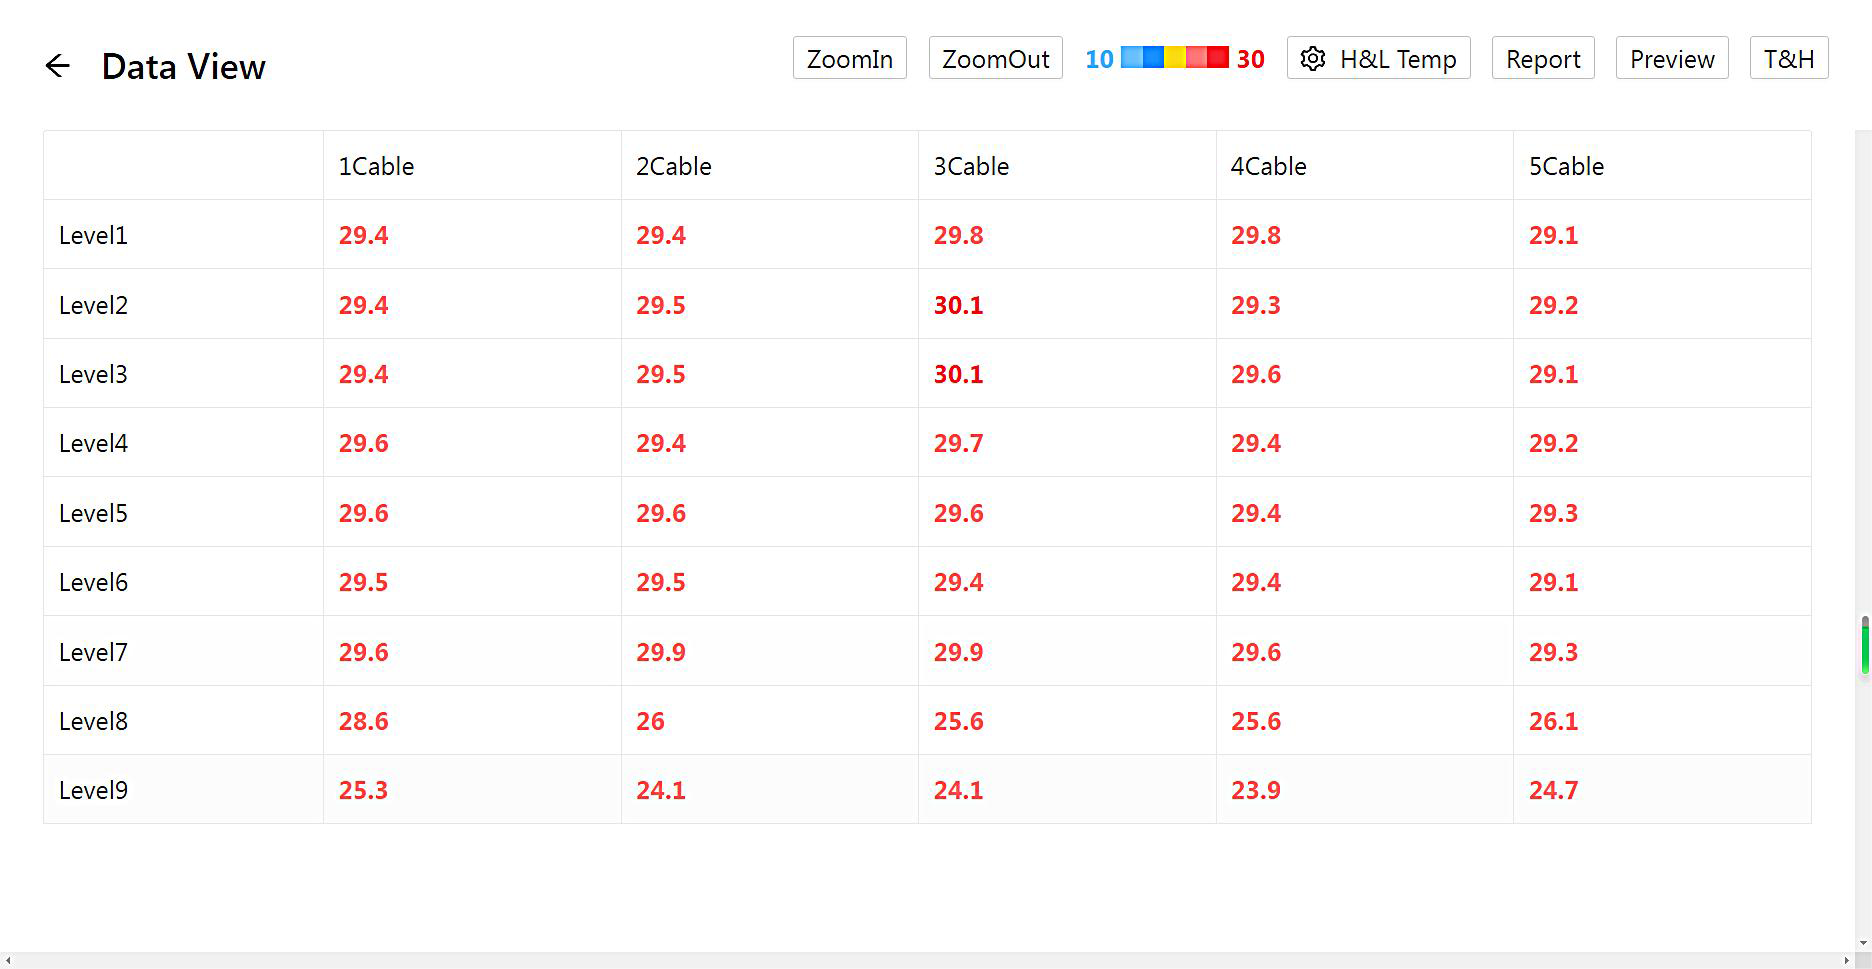
Clear temperature distribution
Android app can clearly display the cable number of each sensor, the level number and temperature of the cable. It is convenient to quickly find the corresponding position of the high grain bin temperature sensor.

Extra long temperature measurement distance
Handheld can monitor the grain bin temperature sensor beyond 800m. You can extend the grain bin temperature cable to the lower part of the silo, the office, or anywhere in the factory. It can read the sensor number and temperature into the android app within 8 seconds.
Historical data and temperature data export to excel
Android app can store 300 times historical temperature data and you can open the application at any time to view the historical temperature data. You can also export historical data to excel.


Android Application and computer connection
As long as the Android phone and the computer are in the same Local Area Network, any computer can access the data in the android app through a browser to view the real-time temperature, the historical temperature, and export to excel.
Video(The handheld version of the silo temperature monitoring system)
Checking temperature/humidity
Edit cable num
Store temperature data
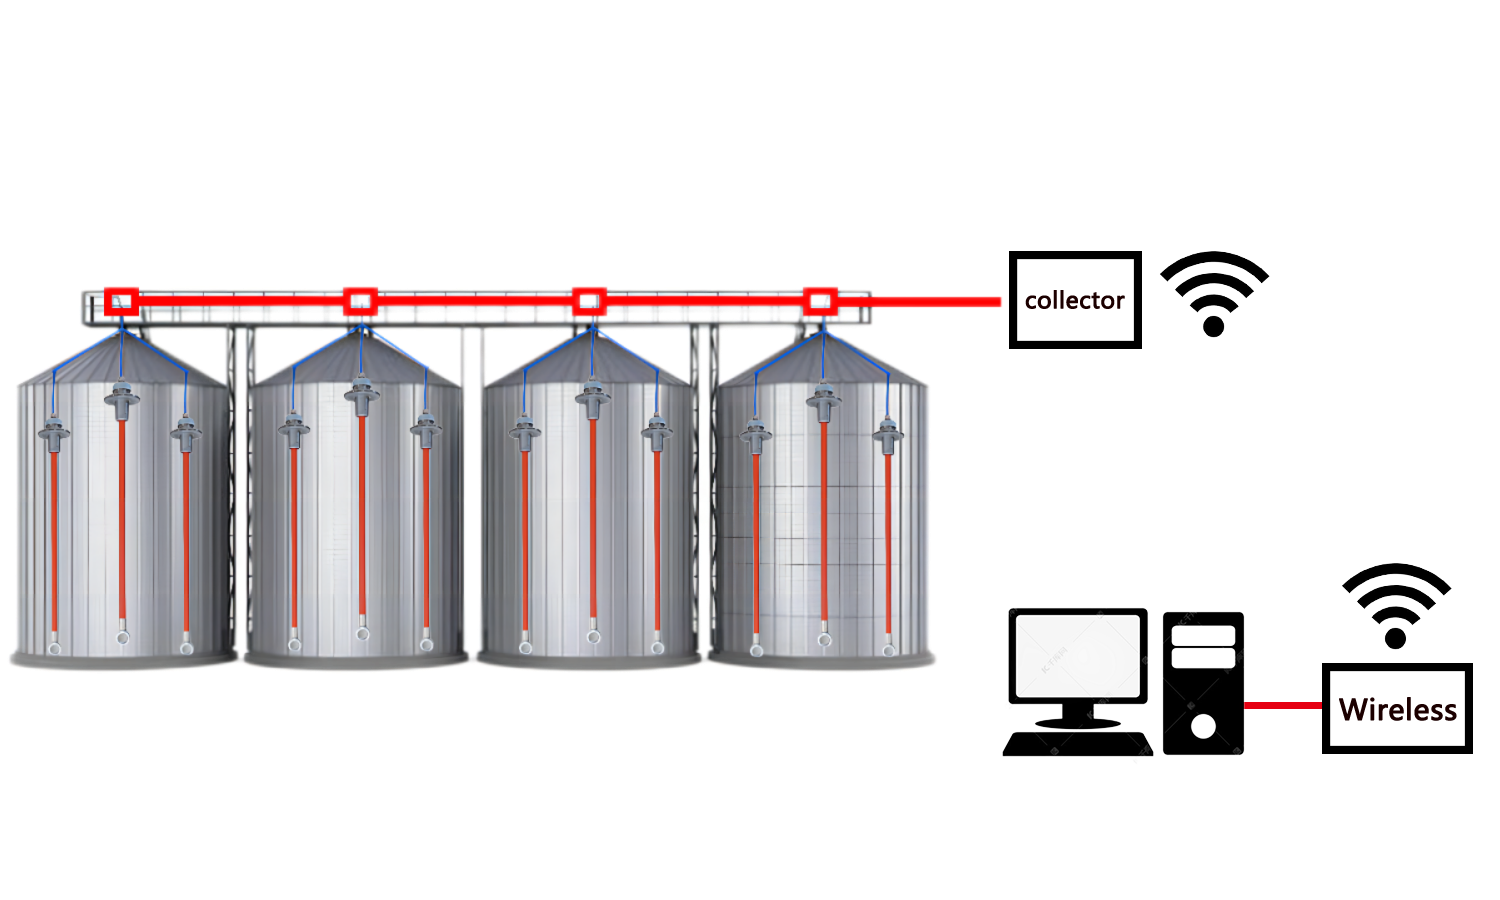
PC monitoring version is to collect the temperature in the silo by wireless.The temperature of silos is displayed graphically on the PC.
It can store temperature data for more than 3 years / monitored regularly /
can show high and low temperature / graphically display the historical temperature / draw temperature-time curve / export historical temperature data to excel.
Advantages
- Graphical show
- Set high and low temp threshold
- Store temp data for 3 years
- Unattended / automatically store data
- No communication cable is required. wireless is sent to the office
- Unlimited number of sensors
Graphical show
Each sensor is displayed on the temperature display page. Can set high and low temp threshold. Each sensor displays different colors at different temperatures. User can quickly find the sensor position at high or highe temperature.


Historical Temperature
The temperature data of each sensor will be stored in the database (the storage interval can be adjusted to 4 hours, 8 hours, 12 hours and 24 hours). It can easily and quickly view the historical silo temperature in the way of graphic display.
Curve diagram
PC monitoring version can draw the temperature curve of all sensors of a single cable / Average temperature curve of single silo / Curves of all sensors at each level. User can move the mouse to any place to view the current specific temperature data. Convenient for user to trace the quality of grain.


Temperature collector
The temperature collector uses MODBUS-RTU communication protocol and has two 485 interfaces. While monitoring by PC, can access the temperature data to PLC, configuration screen or configuration software. Our wireless can send temperature data over 5KM to the office by wireless way.
CLOUD monitoring VERSION is an upgraded version of PC monitoring version. You only need to add 400usd to enjoy all the functions. It can view the temperature of silo anywhere in the world. It has two ways: mobile app viewing and website viewing. It has branch office structure. If user have a head office account, you can view the real-time temperature and historical temperature data of each branch.

Advantages
- Graphical show
- Historical data over 6 months
- Check temperature anytime, anywhere
- Branch office structure
- Android app or website two viewing methods
Management Map
For multiple site’s user, CYTC CLOUD web-based platform shows the management map, user could check any site status in user’s sites list even the site locates in different countries.
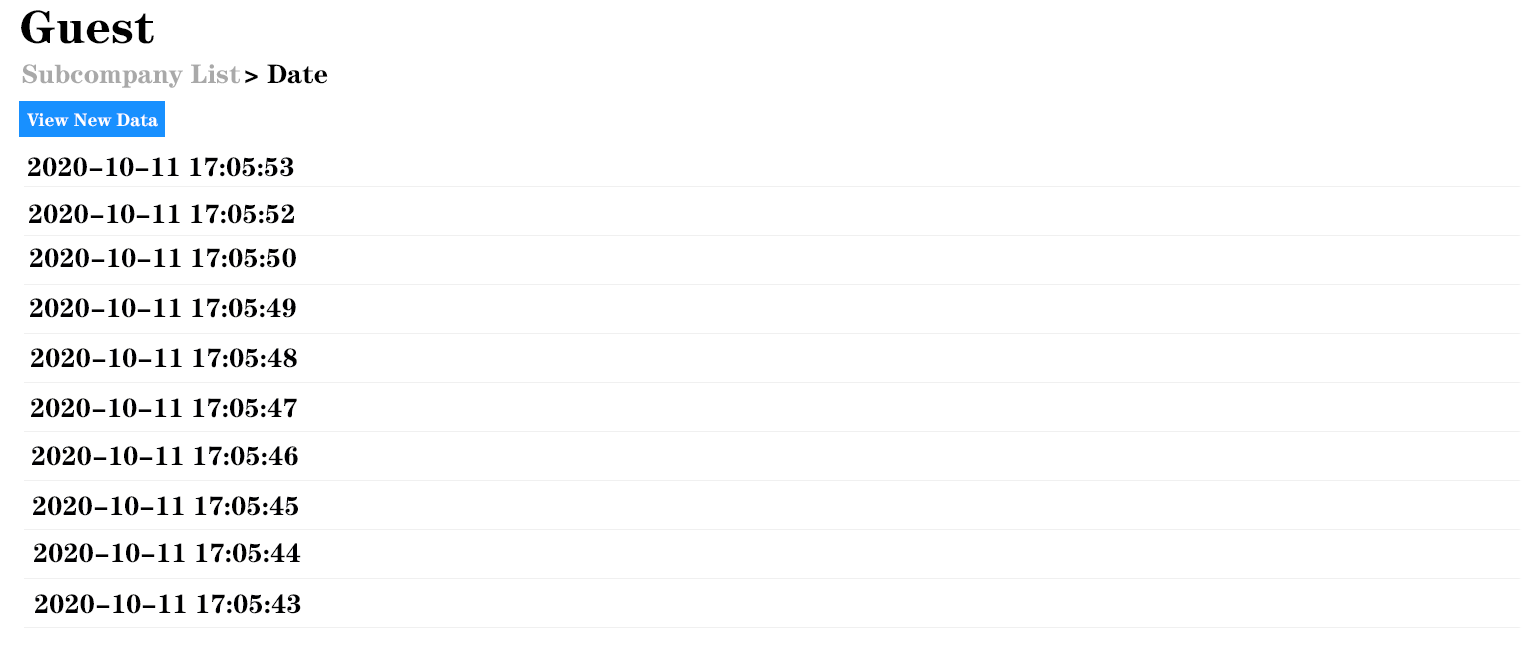
Instant Data
At instant data page, user can get the latest temperature data with last update time tag. The background with blue would be filled in the table that stands for the stored grain level.
Cloud Alerts
User can set over temperature alert for any of the sensor in the site. Just key in your email address or phone number, user will be notified at the first moment when grain temperature is over the user’s setting.


Historical Temperature
For a manager, we also provide the function with historical data plot. The data time interval of historical data plot would be set dynamically according to user’s selecting period. User can move on the each of curve, and the historical temperature and time would be shown on the top.
CONTROL version is a complete management solution for protecting user's grain 24 hours a day. According to the grain level and setting, CYTC Control would turn on/off the corresponding equipment (air conditioner or fan) automatically at the right time. On the home page, user can realize which silo is cooling or ventilating with our specific icon. Moreover, user even can customize period for auto controlling.

Advantages
- Complete management solution
- Customized management period
- Protect grain 24/7
- Clear & Simple icon
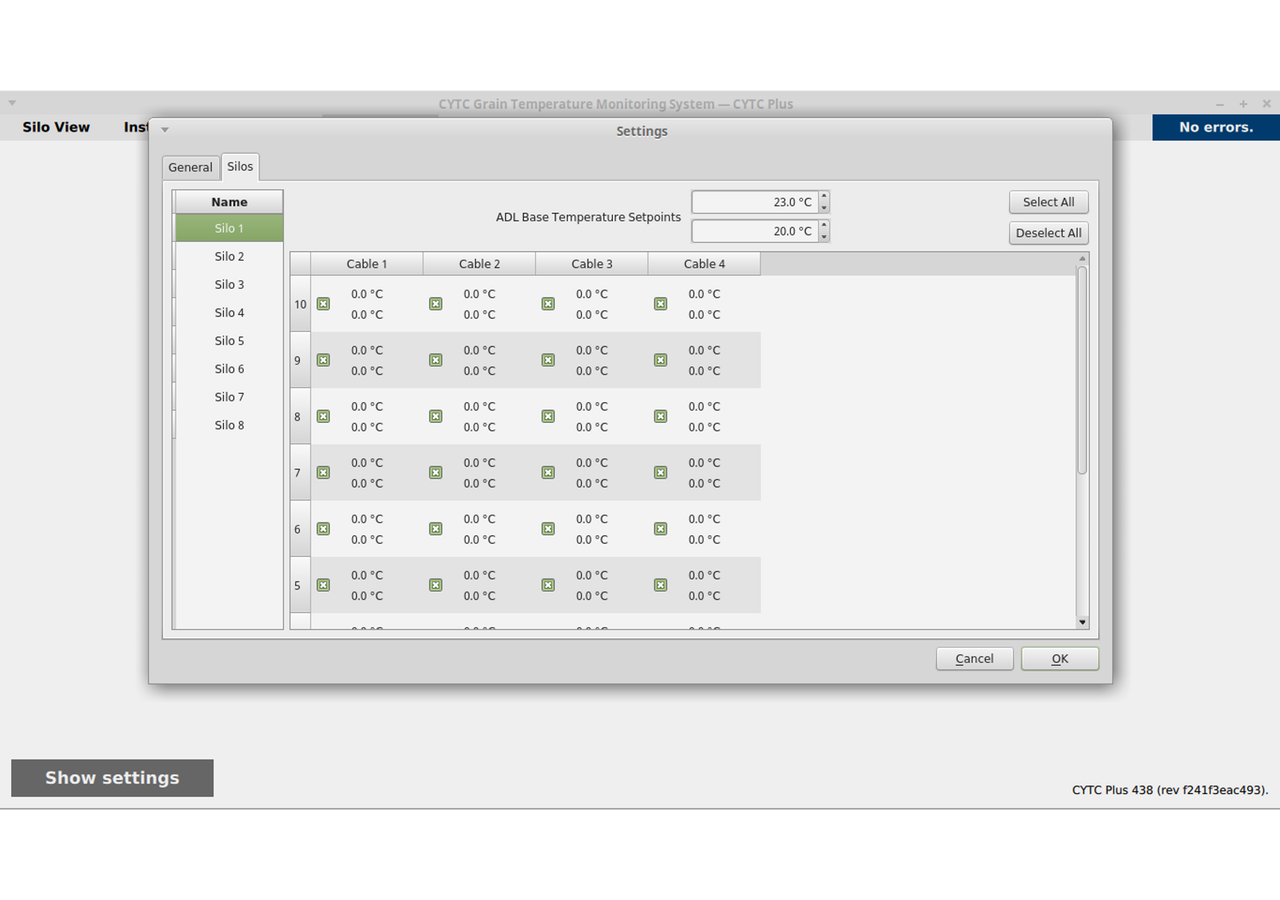
Specific icon
When over temperature, condensation is occurring in the silo, there appears the corresponding icons on the home page. Under auto mode, user can realize which silo is over temperature and is cooling at a glance.
Customizable Control Time
User can set their prefer period to enable the auto control mode. Through this way, user can balance their cost and keep their grain safe simultaneously.
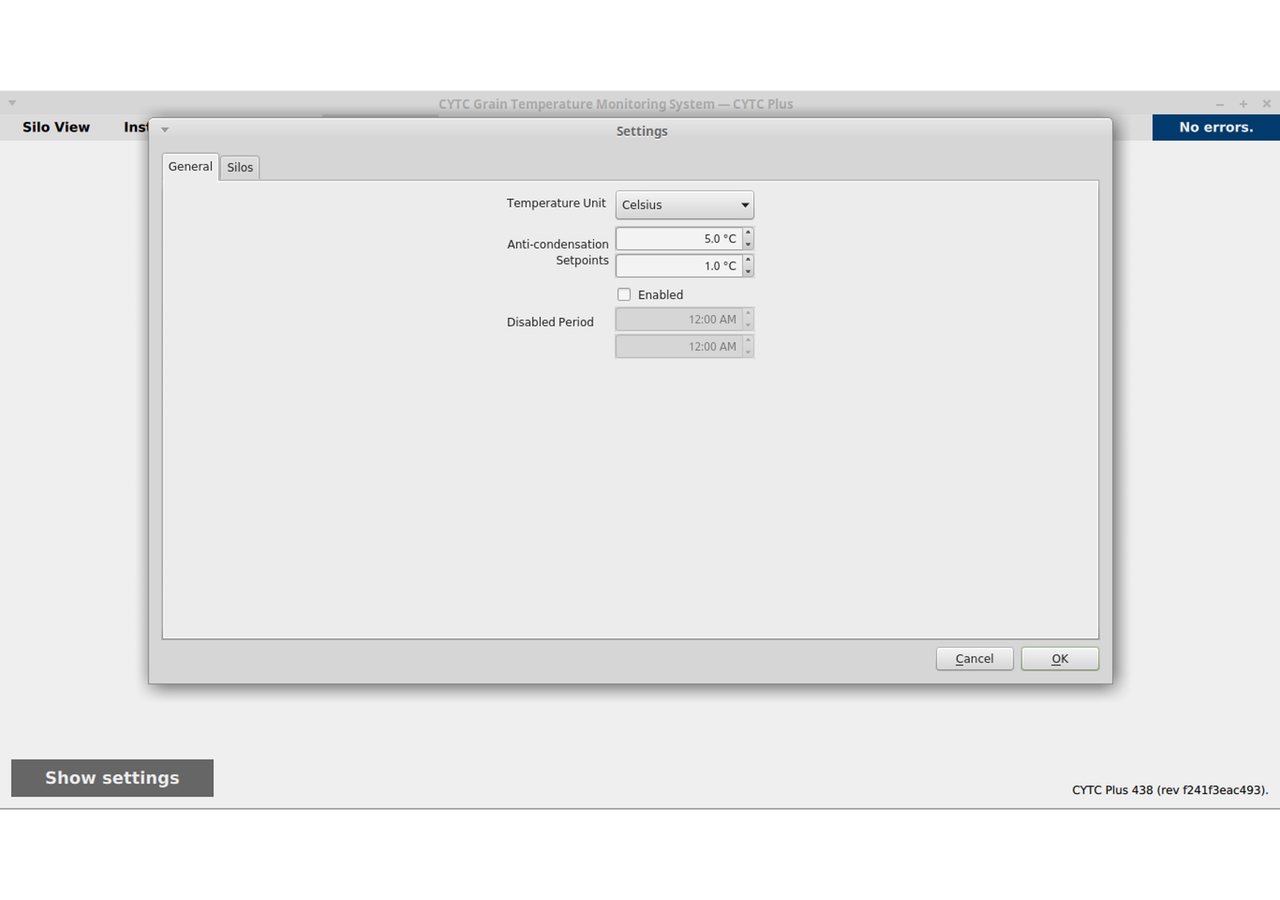
Customizable Moisture Content
In the CYTC CONTROL, user can set the moisture content(MC) and temperature threshold. Air conditioner would be assigned humidity to adjust moisture content according to the parameter.

Flexible system configuration
Even user has multiple sets of cooling equipment, CYTC CONTROL can manage groups of air conditioners and fans at one time. User also can exclude the specific silo/bin in control list.
Digital grain bin Temperature Cable Digital grain bin temperature cable (DTC) has a casing with strong strength and wear resistance, and can be used in silos and bins for a long time without damage. The DTC housing is specially designed to be fully explosion-proof, dust-proof and rain-proof. Users can easily replace the damaged sensor's inner tube even if the cable is buried in particles. The standard spacing of the DTC is 1.5 meters, or sensor spacing can be determined according to user requirements. The temperature range of DTC sensor is from -10°C to +85°C, and the temperature measurement is accurate to ±0.5°C to ensure the temperature measurement accuracy of silo

Advantages of cable
- Dustproof, waterproof, high temperature resistant
- Easy sensor replacement
- Replaceable inner core and other advantages
- Free calibration for life
Cable Specification
- Number of Sensors : 1-70
- Sensor Spacing : Customized ((standard 1.5m)
- Tensile Strength : ≤ 7T
- Temperature Accuracy : ± 0.5 °C